Let's say you're really getting into photography and getting to know more and more about your camera and its settings. But what's that graph on the screen of your camera when you've captured a photo? That's the histogram and we're going to explain what it shows and how you can use it to your advantage below. After reading this page, you'll know even more about what's possible with your camera!
What is a histogram? | How do you read a histogram? | over- and under-exposure? | black or white
The histogram is found on the screen of your camera and looks like a kind of graph. On this graph, you can see if a captured photo is properly exposed. The histogram shows how strong the light intensity of the photo is, with dark tones, light tones and all tones in between. On the left-hand side of the histogram, you'll find the dark tones and the light tones on the far right. When you see high peaks in your histogram, it means that there is more information for that tone in the image. A histogram doesn't literally represent the colours but rather the brightness of each colour. For example, dark blue takes on a darker hue and will be displayed more on the left. And light blue will be rendered on the right side because it is a light shade.
Example of a histogram
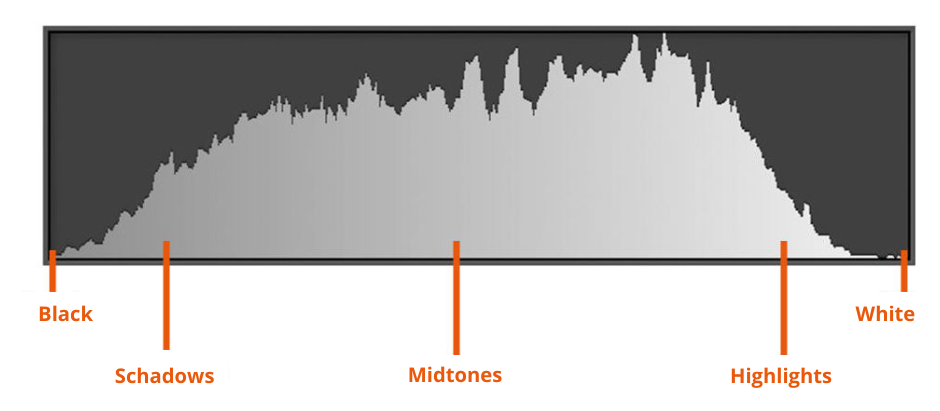
Like a book, a histogram is read from left to right. The horizontal line indicates the brightness from dark tones (black) to light tones (white). In between are many different shades of grey. The vertical axis of the histogram indicates the amount of pixels of brightness. There are no particular numbers attached to this and therefore it is a relative quantity. The higher the peak in the graph is, the more pixels of that brightness can be found in your photo.
A generally well-exposed photograph has a histogram that resembles a mountain. That is, a nice curve with the top in the middle of the histogram. But there are always exceptions to the rule! Because obviously you're not always shooting in the same kind of setting. In fact, your histogram will often vary due to the environment you are in and the camera settings you use. You can also read about this below in the section on photos with lots of black or white. The bottom line is that the "perfect" histogram does not exist. However, it is important that the peaks don't drop straight down suddenly or that there are too many pixels at the edges of the histogram. That's because this means that details of your shot will be lost in the shadows or highlights.
A histogram is very useful if you're in doubt about whether your photo is sufficiently exposed. It can immediately show you if you're shooting in too dark or too light conditions.
In a photo that is overexposed, you'll see nothing at all or almost no peak on the left side of the histogram. On the contrary, the right side of the histogram will show a high peak. You can tell from this that there is too much light/white and not enough shadow/black showing in the photo you took.
An underexposed photo will actually display an inverted histogram compared to the one decribed above. You'll now see a high peak on the left side of the histogram and hardly any peak on the right. So this means that there is too much shadow/black and too little light/white in the photo.

An example of a photo that is under, well and overexposed.
There are also cases when your histogram should just have a peak on the left or right side.
If you take a picture of a subject with a lot of white in it, your histogram will indicate that the picture is too light with a peak on the right side. But you want this photo to have this lighting because otherwise, the white colours won't show up well. So this means that you still have your photo exposed just fine despite the fact that the histogram shows a large peak on the right side.
Conversely, this is also true for a dark photo, for example, when you take a portrait photo with a black background. The histogram will then show a high peak on the left side since your camera thinks it's very dark. But you obviously want a photo with a black background to be dark since there will be a lot of black in the photo. So in this situation, the photo is well exposed even though you have a peak on the left.

This photo will in the histogram say overexposed

This photo will be underexposed in the histogram
So it's important not to blindly rely on the histogram to determine whether a photo is properly exposed. As you read above, it also very much depends on where and when you want to take your picture. The histogram is a very useful tool to see if a photo is too light or too dark but ultimately you have to be very mindful of the conditions which make up your perfect picture.
Check out these amazing articles: